Rover Part 4: Going Wireless
The Raspberry Pi 3 has arrived in the mail and I have connected it to the chassis and electronics of Rover1. The RPi3 is being powered by one of those cheap external phone charger battery things and it seems to be running fine for about 2 - 3 hours before I need to recharge. Currently the RPi3 is running Raspbian as it is very easy to get up and running without an external screen or keyboard. If you have an external screen and keyboard, I would recommend installing Ubuntu (a ROS supported OS); however, a headless Ubuntu install on a Raspberry Pi is… complicated.
In my last post I talked about creating a communication protocol between Python and the Arduino. With the addition of the RPi3 and battery pack, Rover1 is now capable of untethered operation. Setting up Raspbian to auto-connect to the local WiFi network was achieved using this tutorial by We Work We Play.
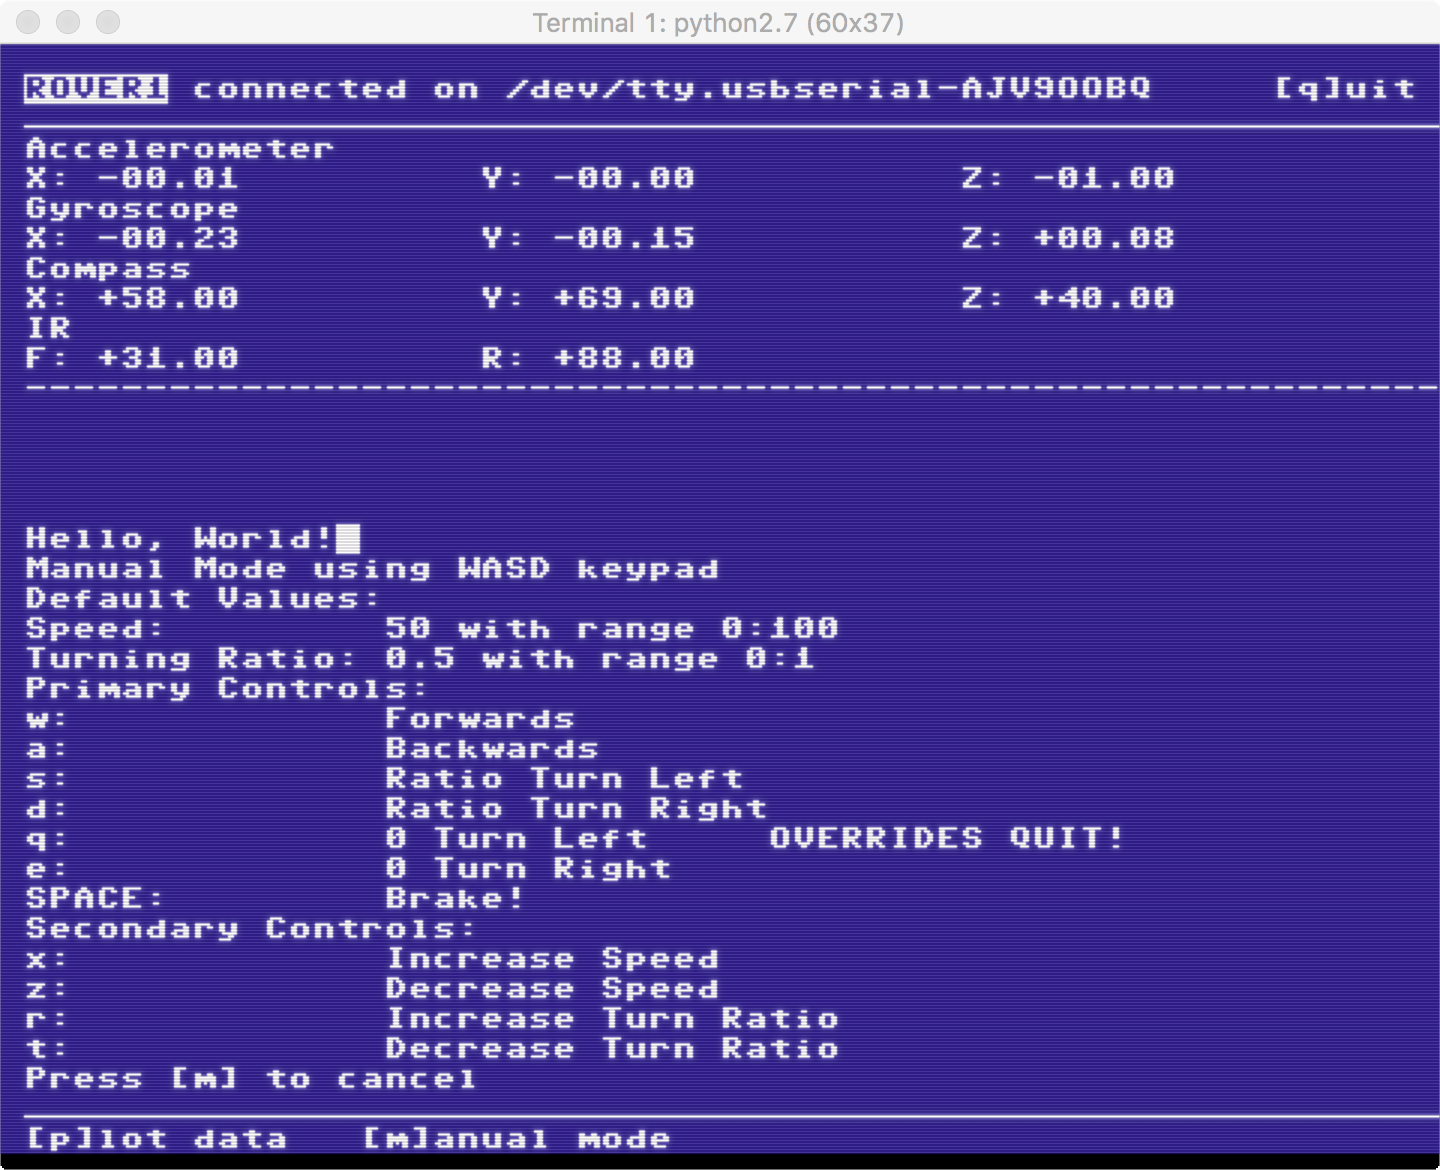
I expanded upon the communication functions I wrote in my last post and have created a Rover class in Python. This Rover class provides methods to interact with the Arduino-based motor controller and connected sensors. To help create and test the Rover class I made a text-based user interface, which I can interact with via SSH over WiFi. To make this user interface I used a library called curses.
Building a text-based user interface with curses.
Curses is old. Ncurses, as in ‘new curses’, came out in 1993. If you want to build pretty graphical user interfaces, there are many tools better suited for this task (for Python, for example Kivy or tkinter). If you want to build a text based UI for use in the command line, you want curses. A wrapper for curses is included in the Python standard library and should operate on all *nix systems (and maybe Windows?). Curses provides methods to read from the keyboard and mouse in addition to the ability to draw text to a ‘screen’ that is displayed in the host terminal program.
The anatomy of a Python and curses user interface looks something like this:
# Python curses example
import curses
import datetime


def main(screen, arg1):
    curses.curs_set(0)                      # Set cursor visibility where 0 = invisible,
    screen.nodelay(True)                    # Set getch() to be non-blocking - important!
    curses.use_default_colors()             # Lets your terminal client set the fonts and colors
    ymax, xmax = screen.getmaxyx()          # Get the screen dimensions
    screen.addstr(1, 1, 'Title Text')       # Add the text 'Title' at (y, x) = (1, 1)
    screen.addstr(ymax - 1, 1, '[q]uit')
    quit = False
    while not(quit):
        user_input = screen.getch()         # Read from the keyboard.
        if user_input == ord('q'):
            quit = True
        now = str(datetime.datetime.now())
        screen.addstr(3, 1, now)
        screen.addstr(4, 1, arg1)

additional_arg = 'Hello, World'
curses.wrapper(main, additional_arg)        # curses.wrapper makes a curses screen that handles any errors thrown and returns to terminal cleanly
I occasionally used the iPython shell to test various Rover class methods before linking them into the curses UI. The Python deque datatype allowed me to create a message console system that updated the user and automatically dismissed older messages. Setting
screen.nodelay(True)
ensured the reported sensor data was not delayed or blocked by the user interface loop. Once I had a non-blocking loop, I was able to link various keystrokes with actions.
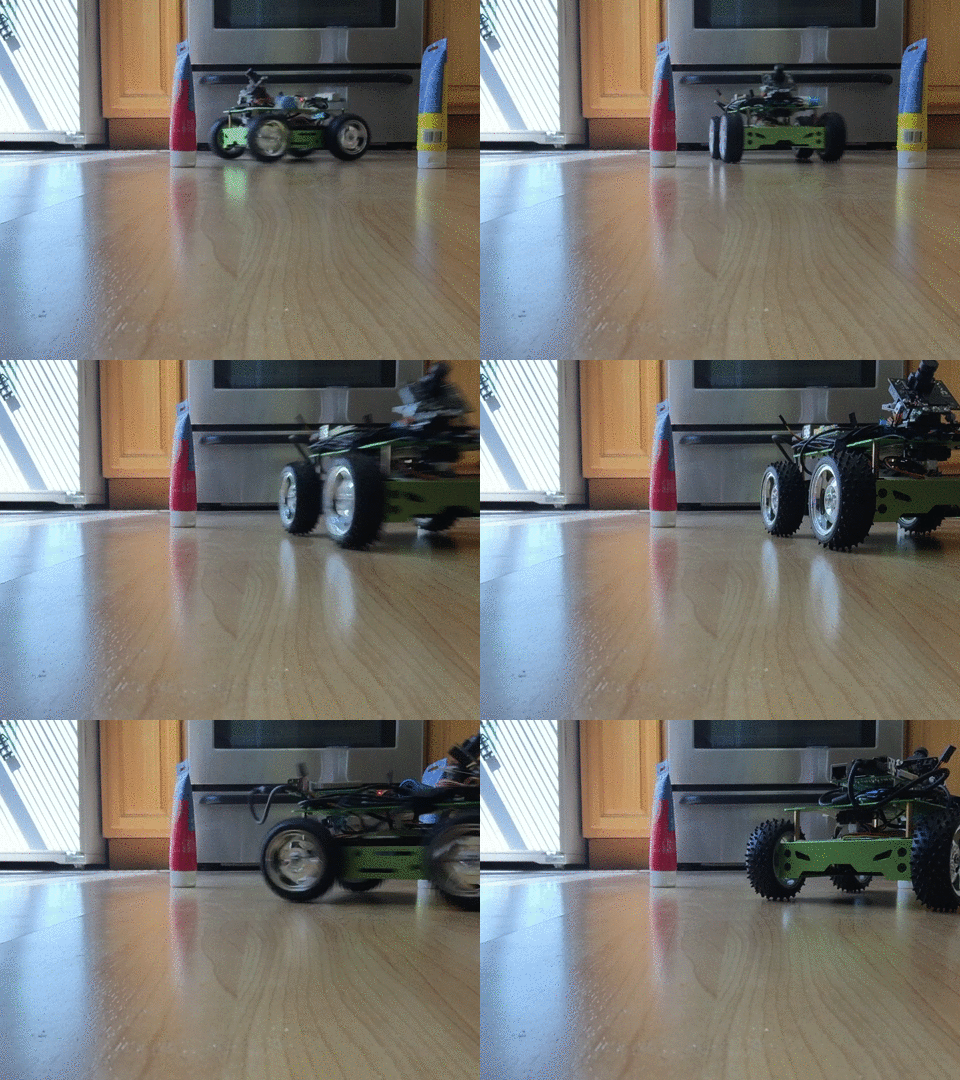
I created a ‘manual mode’ that allowed me to drive the rover around using WASD keys like a toy RC car. Using SSH over my local WiFi network to login to the RPi3 while it ran on battery, I could control the rover in manual/WASD mode to drive around (and over) obstacle courses!
 Getting decent footage of Rover1 while operating is difficult.
The Sensor data is displayed on the screen. These values fluctuate rapidly making it difficult to understand how Rover1’s motion is represented by the sensor data. It would be much easier to graphically plot the sensor data over time but Rover1 does not have a screen.
 I use iTerm with zsh, but Cathode (above) is so pretty
Plotting data from a mobile, screen-less Raspberry Pi.
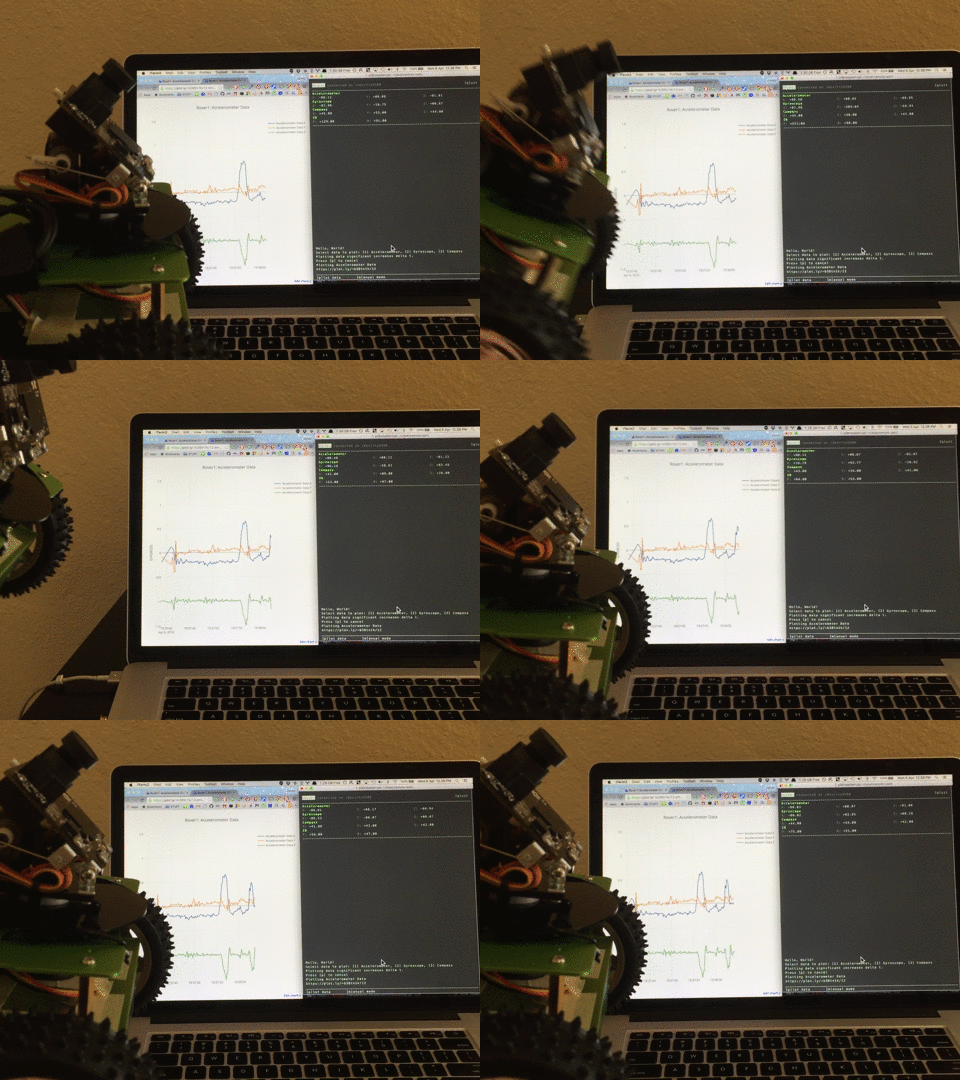
Plot.ly is a graphing service that provides API and libraries for Python, MATLAB, R and Javascript. Using the Plot.ly python library it was possible to create a number of web hosted scatter graphs that would receive streamed data in near real time. I could watch the sensor data in my browser!
 Plot.ly is pretty fast! I never said the sensors were reporting correctly
To simplify the process of creating multiple time series graphs I created a class that handles the streaming API authorization, graph creation and subsequent data streaming. I store my Plot.ly API keys in a separate file named ‘stream_tokens.secret’ and added ‘*.secret’ to my .gitignore file.
# Plot.ly x/y/z time series plot constructor
import plotly.plotly as py
from plotly.graph_objs import Scatter, Layout, Figure, Data, Stream, YAxis
import datetime
from time import sleep


def new_time(name, token):
    new_time = Scatter(
        x=[],
        y=[],
        name=name,
        showlegend=True,
        stream=dict(
            token=token,
            maxpoints=500
        )
    )
    return new_time


class XYZPlotlyHandler(object):
    def __init__(self, project_title, name, first_token, units, symm_range):
        with open('stream_tokens.secret') as f:
            stream_tokens = f.readlines()
        x_token = stream_tokens[first_token].rstrip()
        y_token = stream_tokens[first_token + 1].rstrip()
        z_token = stream_tokens[first_token + 2].rstrip()
        x_series = new_time('{} X'.format(name), x_token)
        y_series = new_time('{} Y'.format(name), y_token)
        z_series = new_time('{} Z'.format(name), z_token)
        layout = Layout(
            # showlegend=True,
            title='{}: {}'.format(project_title, name),
            yaxis=YAxis(
                title=units,
                range=[0-symm_range, symm_range]
            )
        )
        data = Data([x_series, y_series, z_series])
        fig = Figure(data=data, layout=layout)
        self.x_stream = py.Stream(x_token)
        self.y_stream = py.Stream(y_token)
        self.z_stream = py.Stream(z_token)
        self.x_stream.open()
        self.y_stream.open()
        self.z_stream.open()
        self.plotly_address = py.plot(fig, filename='{}: {}'.format(project_title, name))

    def update(self, data2plot):
        now = datetime.datetime.now()
        self.x_stream.write({'x': now, 'y': data2plot['X']})
        self.y_stream.write({'x': now, 'y': data2plot['Y']})
        self.z_stream.write({'x': now, 'y': data2plot['Z']})
        sleep(0.1)

    def close_streams(self):
        self.x_stream.close()
        self.y_stream.close()
        self.z_stream.close()
Streaming to Plot.ly has a slight impact on the operation of Rover1. I assume the Plot.ly stream.write() method is partially blocking. My solution has been to only run the plotting program when I want to look at the plots. Using the free community user tier, I am yet to encounter any issues with exceeding my allocated number of API calls.
What’s next?
I have established basic communication for monitoring and control of Rover1. Reading from the wheel encoders with the Arduino required the use of interrupts, which compromised the serial communication. I plan to read from these encoders via the RPi3’s GPIO pins. The Rover class does not yet interact with the Pixy Camera. Once I have all these sensors communicating with the Rover class (maybe just the encoders, Pixy can probably stay separate) I will use this class to introduce Rover1 to ROS - the Robotic Operating System.
But first I need to install Ubuntu…